PHP代码审计(一) 安装xdebug
VSole2021-07-24 14:14:37
xdebug介绍
从其他语言使用者到初次使用phpstorm或者其他ide的小伙伴可能会发现phpstorm默认的调试功能并不 能直接调试php脚本。php不像JAVA,打开一个Eclipse就可以开搞,Php的Debug都要几个插件来配合工作
xdebug是一个开源的php调试器,以php模块的形式加载并被使用。可以用来跟踪,调试和分析PHP程序的运行状况
xdebug官网:https://xdebug.org/
安装xdebug
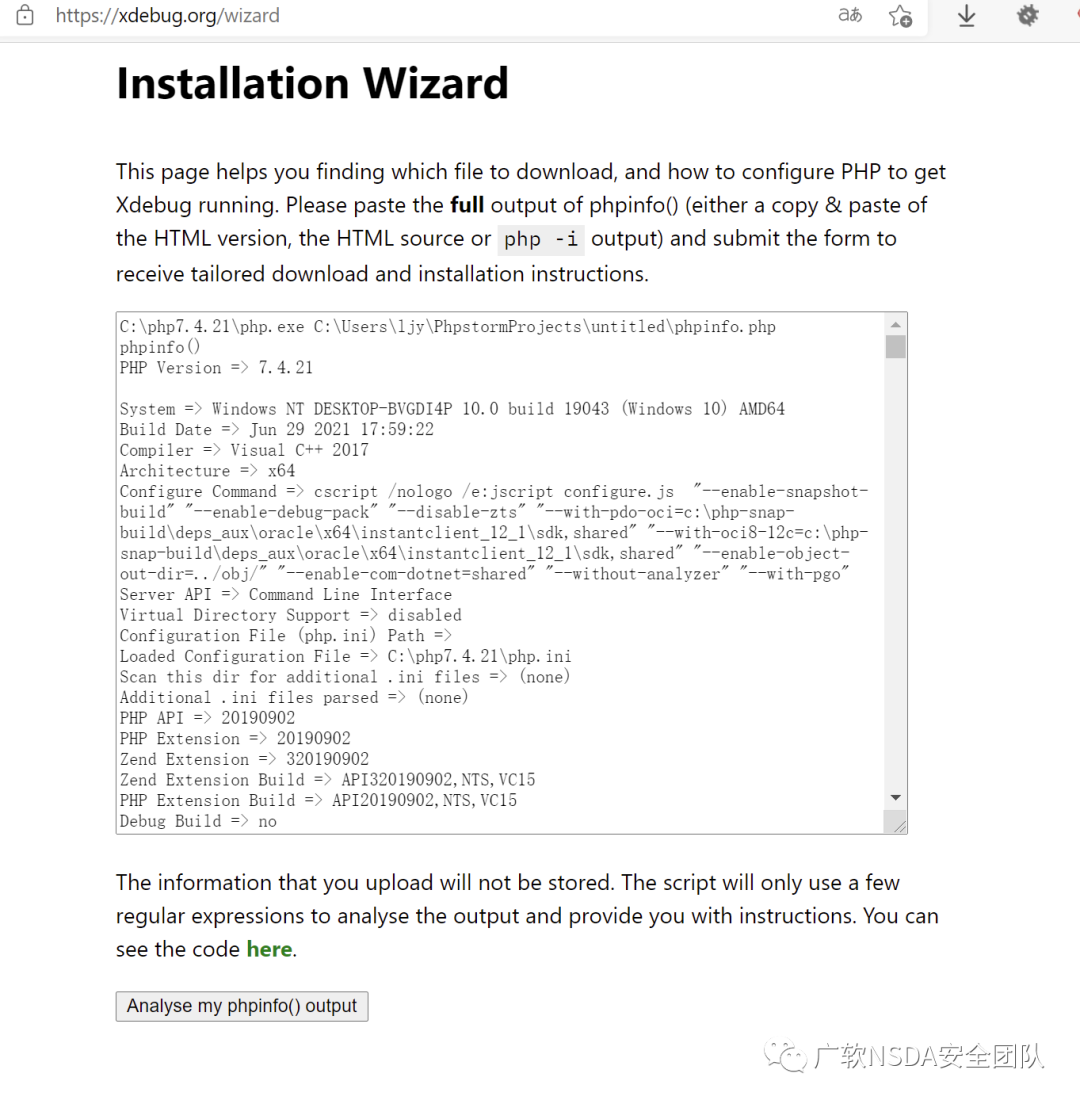
- 将phpinfo内容复制到https://xdebug.org/wizard中查找适合的xdebug版本
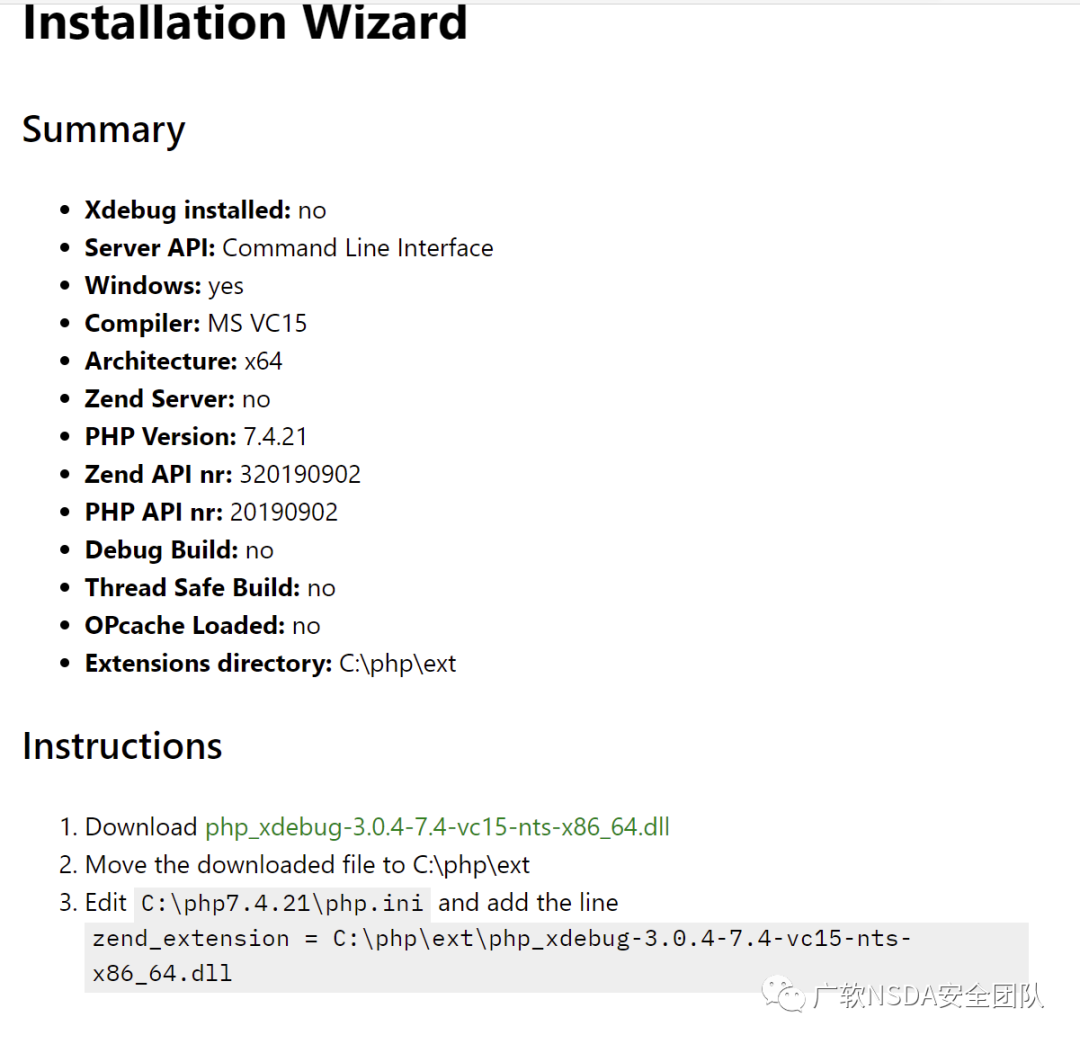
- 根据提示下载dll文件放到指定位置,修改php.ini添加如下内容,其中zendzendextension,xdebug.traceoutputdir,xdebug.profileroutputdir根据自己要求修改
[
Xdebug
]
zend_extension
=
 C
:
\php\ext\php_xdebug
-
3.0
.
4
-
7.4
-
vc15
-
nts
-
x86_64
.
dll
xdebug
.
profiler_enable
=
On
xdebug
.
auto_trace
=
on
xdebug
.
collect_params
=
On
xdebug
.
collect_return
=
On
xdebug
.
trace_output_dir
=
"C:/debug"
xdebug
.
profiler_output_dir
=
"C:/debug"
xdebug
.
profiler_output_name
=

"cachegrind.out.%p"
xdebug
.
remote_enable
=

On
xdebug
.
remote_port
=
9001
xdebug
.
remote_handler
=
 dbgp
xdebug
.
remote_host
=
 localhost
xdebug
.
idekey
=
"PHPSTORM"
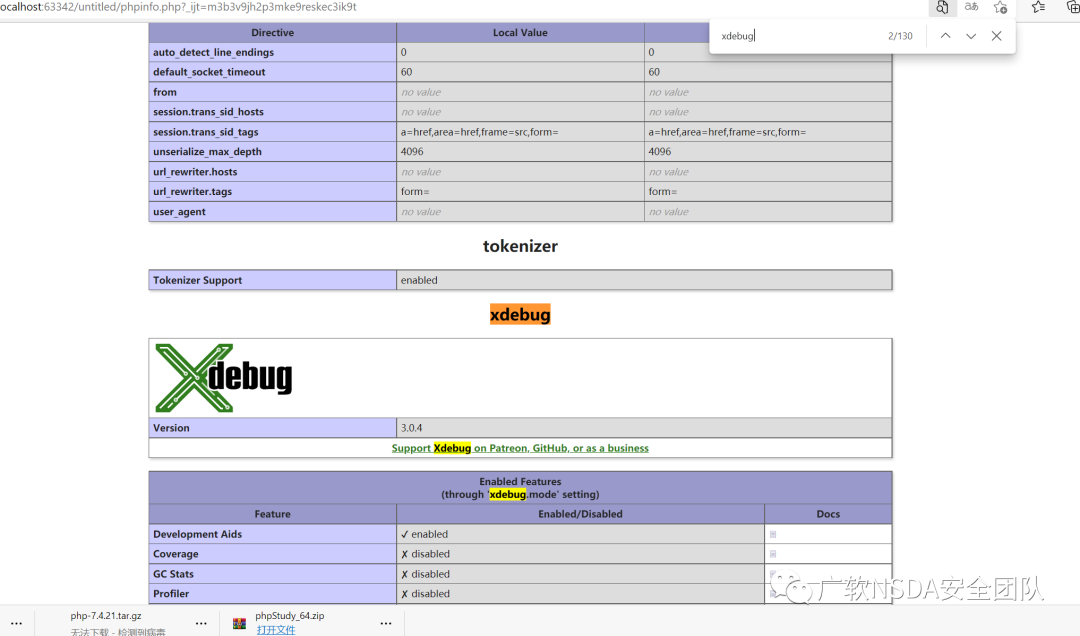
再看一下phpinfo出现这个即安装成功
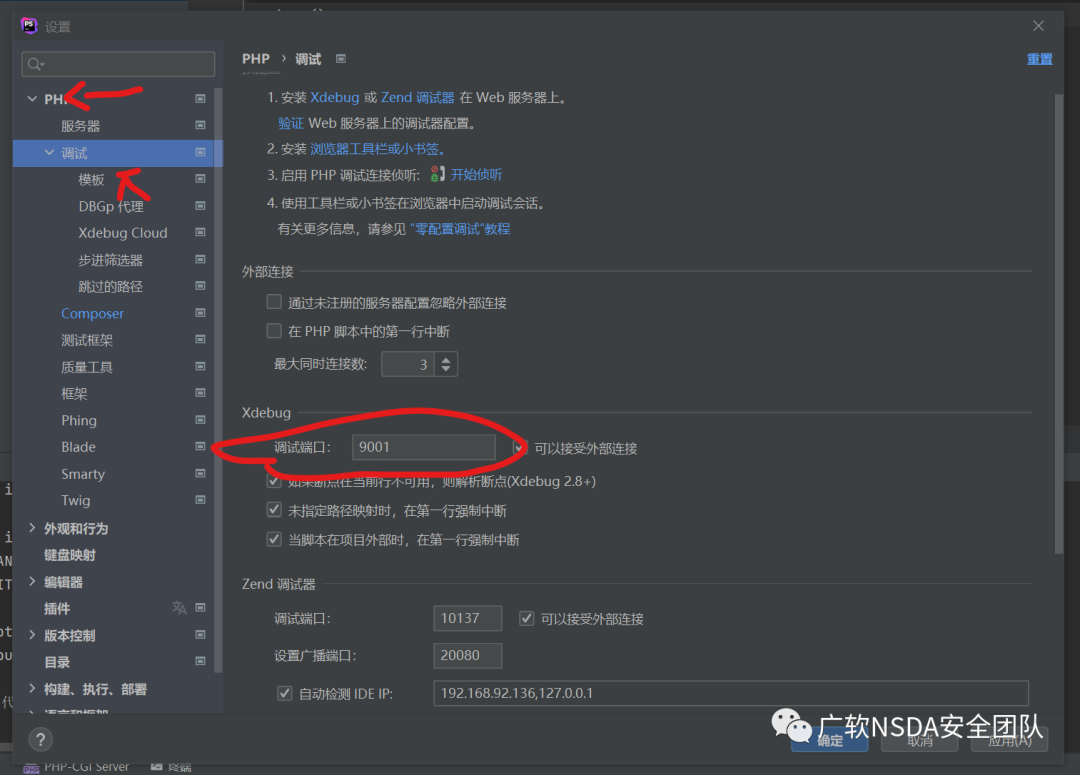
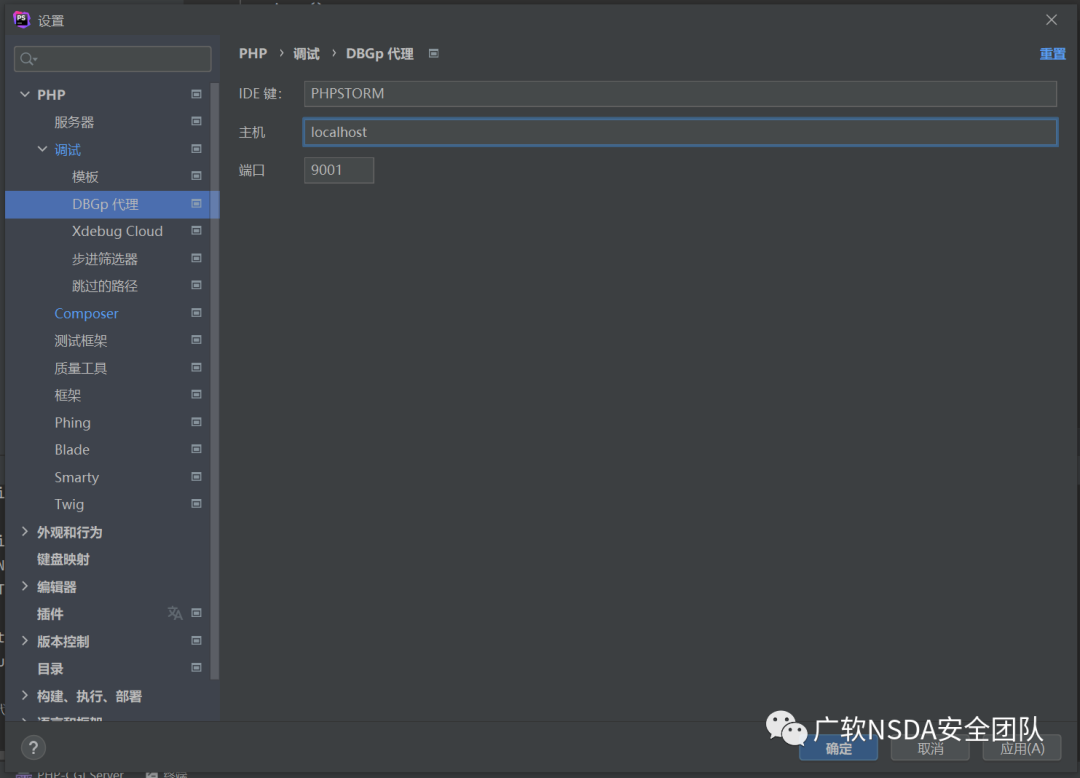
3.配置PHPstorm,修改调试端口为php.ini配置的xdebug.remote_port=9001
配置DBGp代理IDEkey为刚刚php.ini设置的xdebug.idekey,主机为本机ip地址
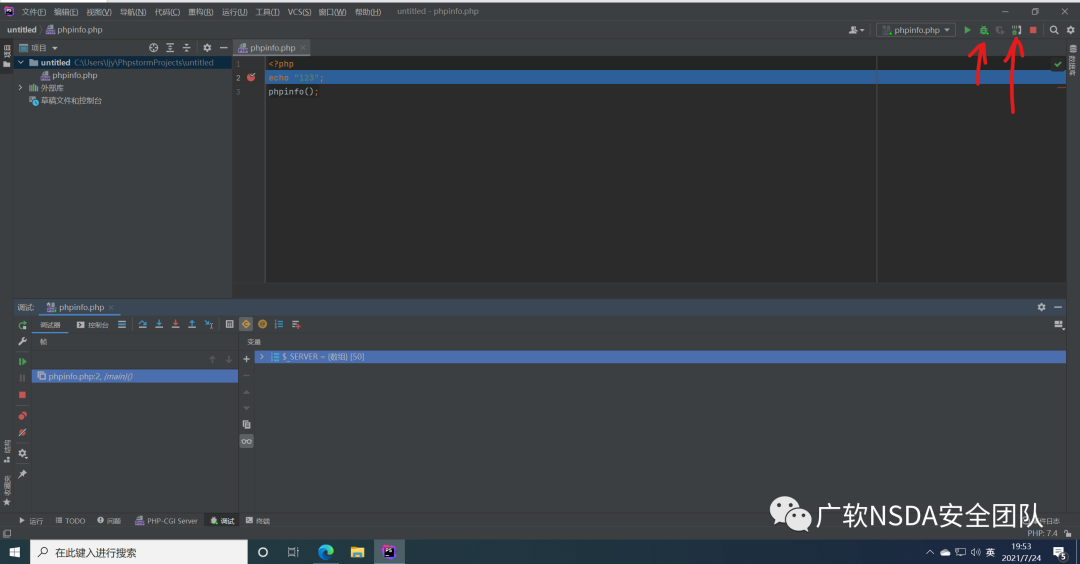
点击开始监听然后点击开始调试发现程序成功在断点处中断

VSole
网络安全专家